KMP Inspector: An In-App Debugger for Compose Multiplatform on Android, iOS and Desktop
By Muhammad Waqas · · 7 min read
Debugging a Kotlin Multiplatform app often means debugging it three different ways. On Android you have Android Studio's inspectors, as long as a cable is plugged in. On iOS you are reading the Xcode console. On desktop you are adding println calls. And when a tester reports a bug from their own phone, none of those tools are there.
I built KMP Inspector to put one set of debugging tools inside the app itself. It is an open-source library for Compose Multiplatform: a small bubble floats over your app, and tapping it opens a full inspector for network requests, the database, logs and crashes, on Android, iOS and desktop, from a single codebase.
This post covers what it shows, how to add it, and how to keep it out of your release builds. There are also detailed guides on inspecting Ktor network requests and inspecting a Room database.
Why an in-app debugger for Kotlin Multiplatform
- Platform tools stay on their platform. Android Studio's Network and Database Inspectors only work for Android, and only while the device is connected to your computer.
- Testers are not at your desk. When someone reports a bug on a physical phone, you want the failing request or the crash trace from that phone, not a request to reproduce it later.
- Shared code deserves shared tools. If your networking, database and business logic live in common code, it helps to inspect them the same way on every target.
KMP Inspector does not replace your IDE's debugger. It covers the gap between "it works on my machine" and "here is exactly what the app did on that device".
What KMP Inspector shows
The inspector has five panels:
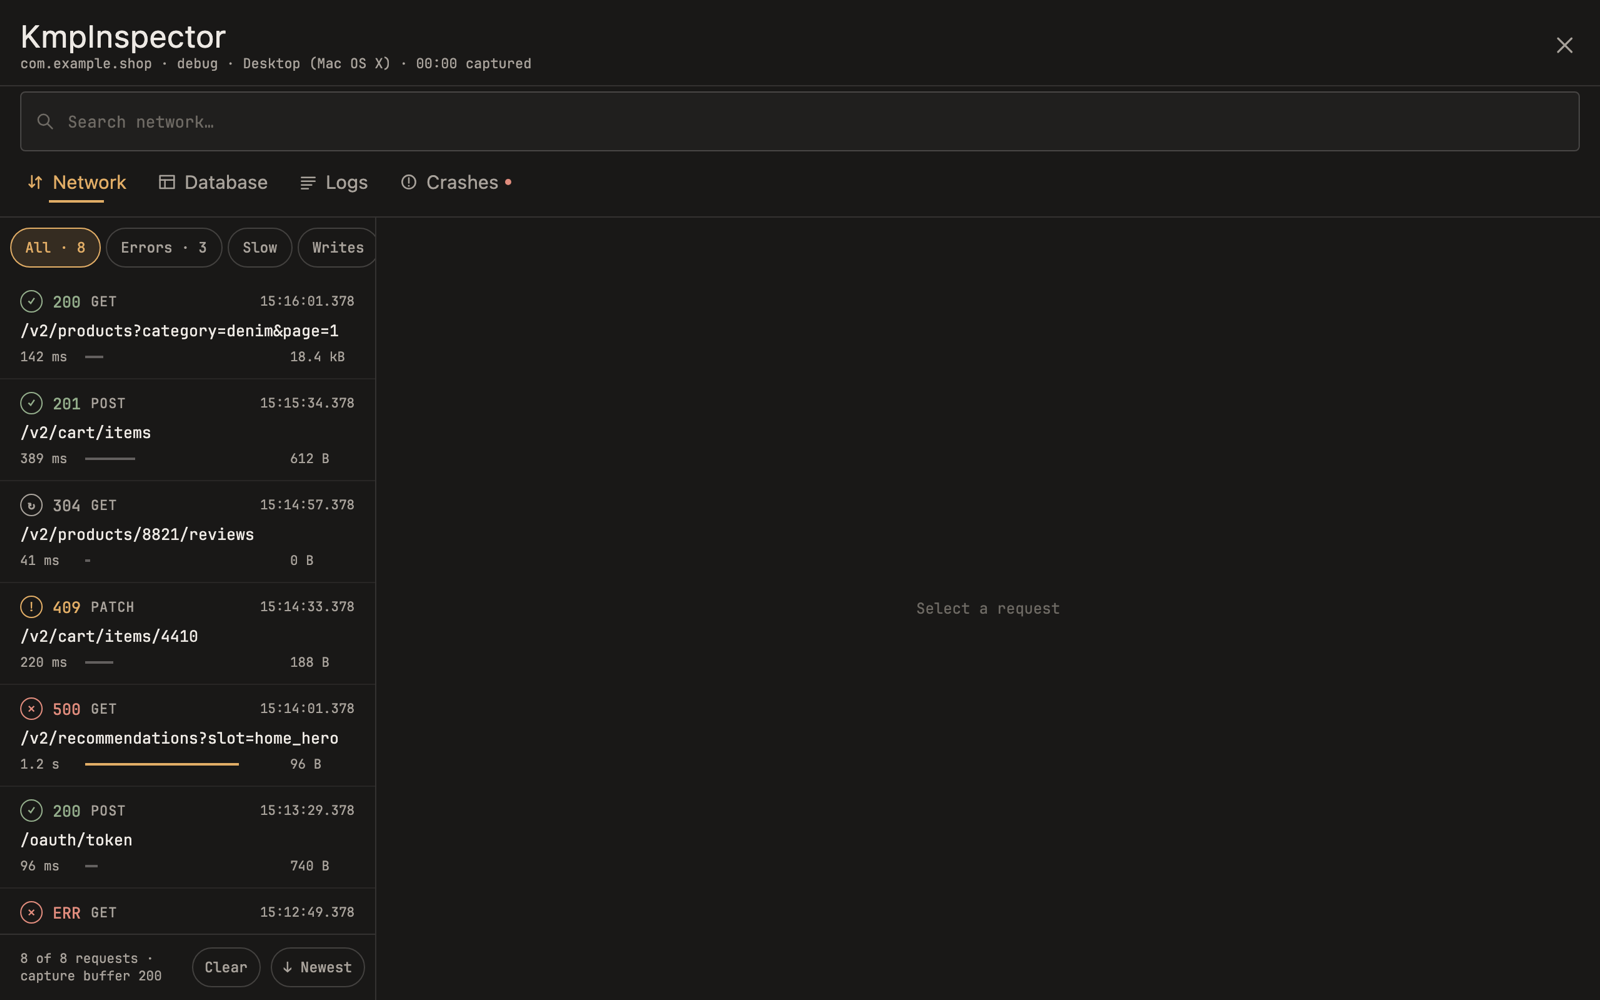
- Network: every request with its method, URL, status code, duration and payload sizes, plus full headers and bodies, with quick filters for errors, slow requests and writes.
- Database: your tables and their rows, a SQL editor, and cell editing when a live database is attached.
- Background Work: on Android, a mirror of WorkManager's job list.
- Logs: a 2,000-line log buffer you can filter by level and tag, and pause while you read.
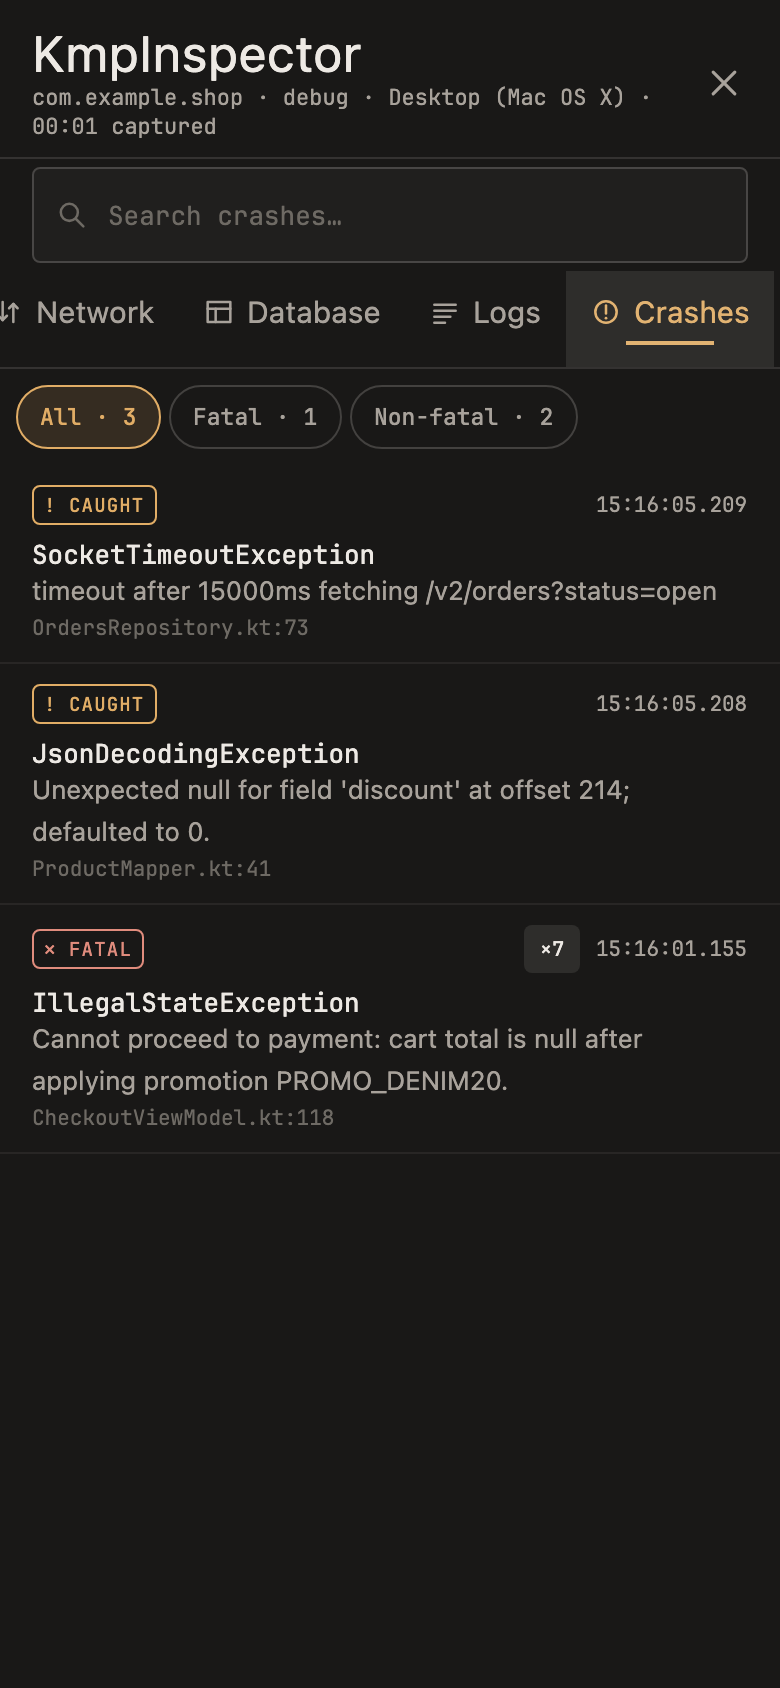
- Crashes: fatal crashes kept across app restarts, plus non-fatal exceptions you record yourself.
How it works
Everything starts with a bubble. You wrap your app's root composable once, and a draggable bubble floats over every screen. It shows how many new events arrived and turns red when a crash is captured. Tapping it opens the inspector full screen, and closing it takes you back to exactly where you were.
How data gets in depends on the platform. On Android, one call in your Application collects crashes, logcat and WorkManager jobs automatically, and one line each adds OkHttp and Room. On iOS and desktop the library draws the UI, and two companion modules fill it: one for the Ktor HTTP client and one for Room. Anything else can be reported through a small API, so it works with any HTTP client, database or scheduler you already use.
Add it to your project
KMP Inspector is published on Maven Central. On Android, use the real library in debug builds and the no-op version in release builds. The no-op has the same classes and functions with empty bodies, so every call site still compiles:
dependencies {
    debugImplementation("io.github.waqas028:kmp-inspector:1.0.0")
    releaseImplementation("io.github.waqas028:kmp-inspector-no-op:1.0.0")
}
If you use Ktor or Room, add the companion modules too. All four artifacts are at version 1.0.0:
implementation("io.github.waqas028:kmp-inspector-ktor:1.0.0")
implementation("io.github.waqas028:kmp-inspector-room:1.0.0")
Android: one line in your Application
class MyApplication : Application() {
    override fun onCreate() {
        super.onCreate()
        KmpInspector.install(this)
    }
}
That single call floats the bubble over every Activity, whether it uses XML, Fragments, Jetpack Compose or a mix. It captures fatal crashes across restarts, streams the app's own logcat into the Logs panel, and mirrors WorkManager jobs when WorkManager is on the classpath. It does nothing unless the build is debuggable. Network and database traffic need one line each:
// Network: add after your header interceptors, so the recording matches what was sent
OkHttpClient.Builder()
    .addInterceptor(KmpInspectorInterceptor())

// Database: Room 2.7 or newer
KmpInspector.attach(database, fileName = "app.db")
iOS and desktop: wrap your root composable
@Composable
fun App() {
    MaterialTheme {
        KmpInspector {
            MyAppContent()
        }
    }
}

// Network, any platform
HttpClient { install(KmpInspectorPlugin) }

// Room, any platform
RoomInspector.attach(database, fileName = "app.db")
Avoid two bubbles on Android. If your shared UI wraps KmpInspector { } and Android also calls install, turn the wrapper off on Android with its enabled parameter.
A tour of the panels
Network
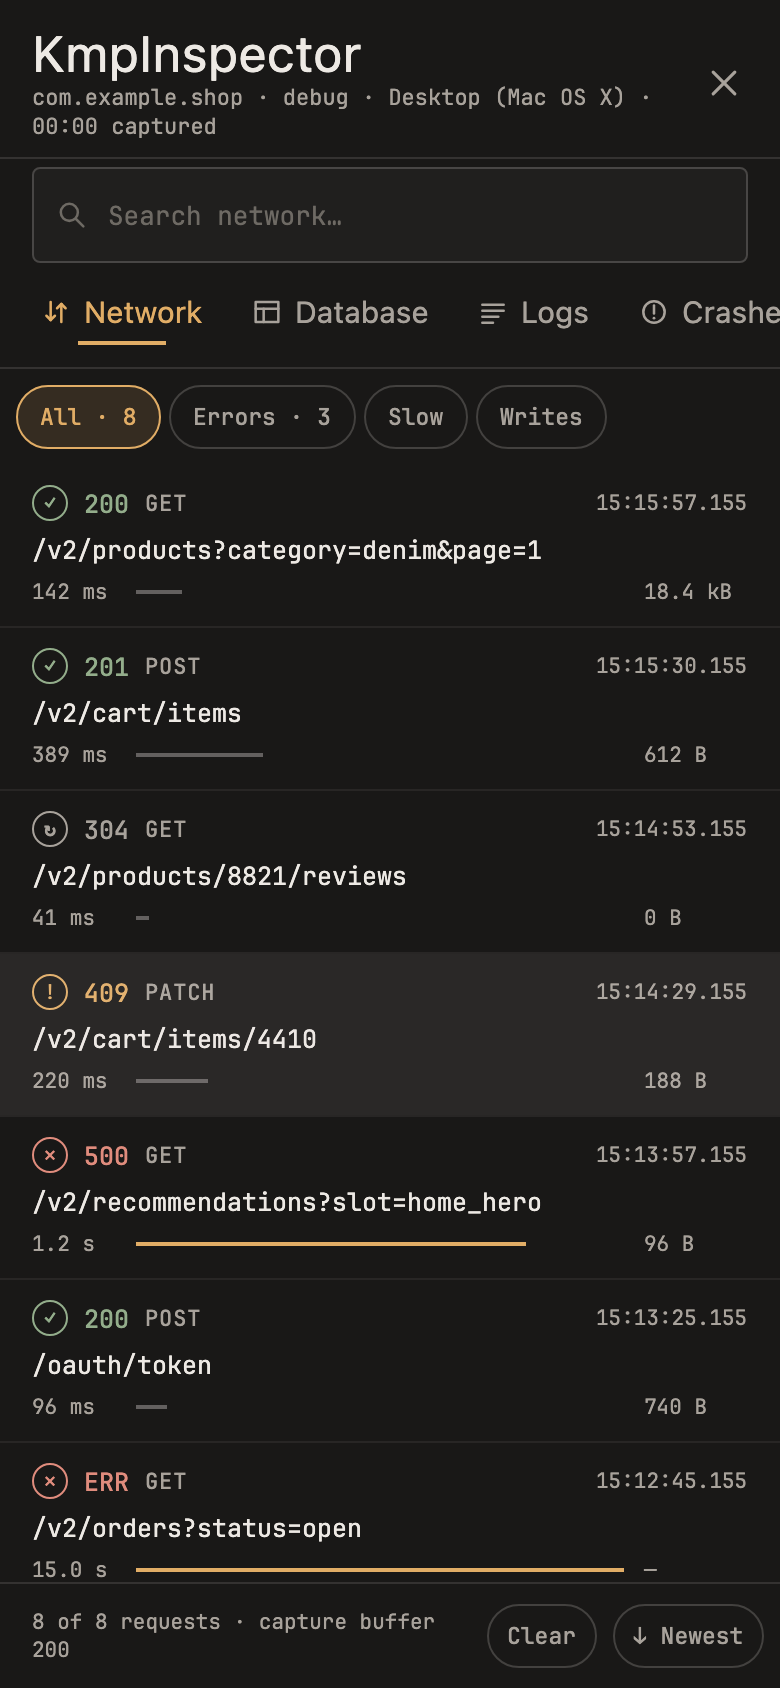
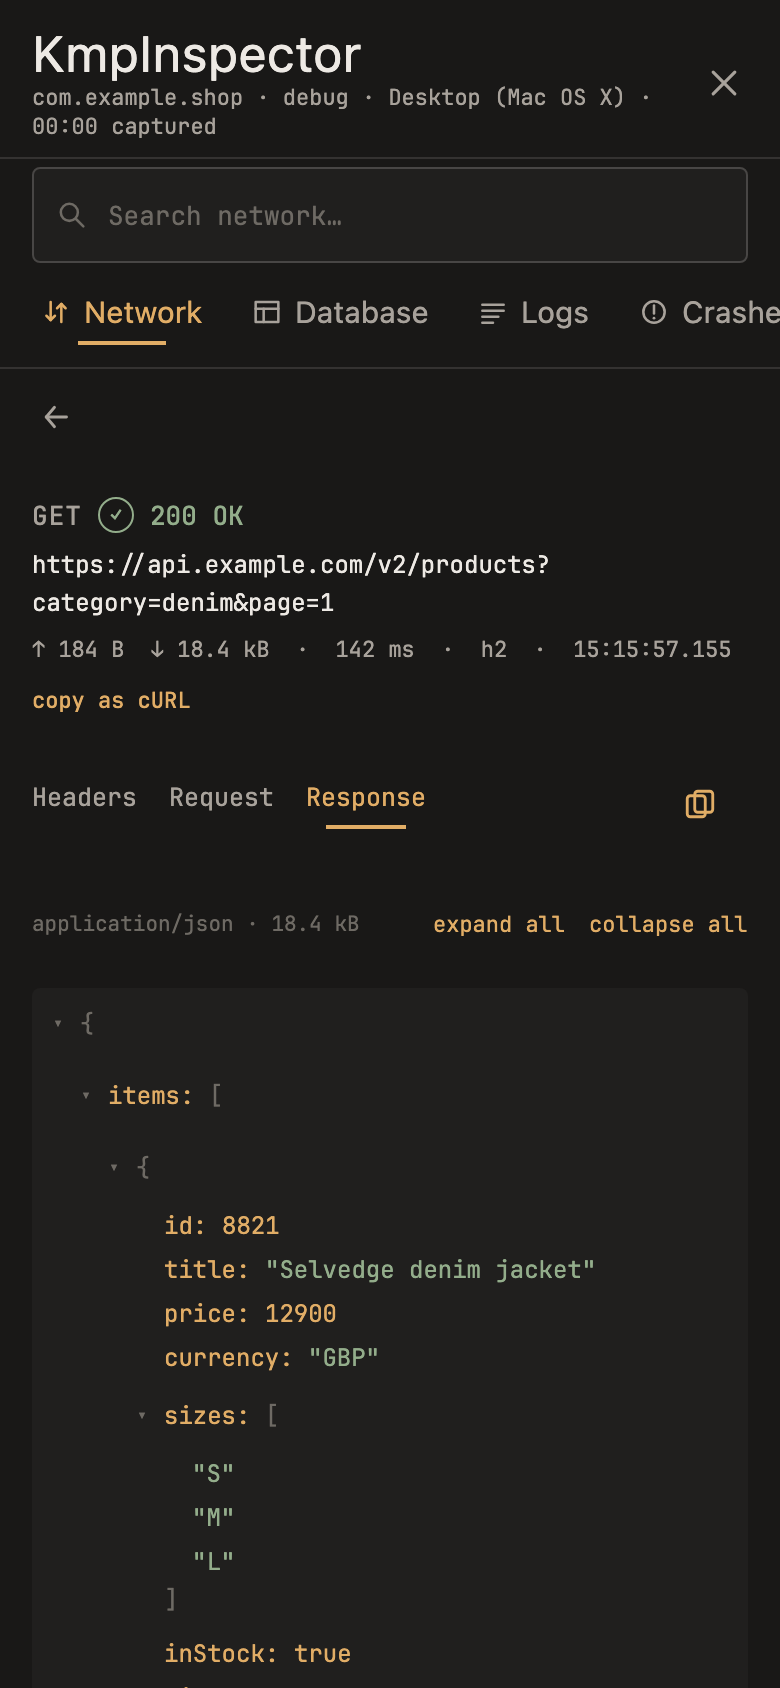
The list shows the newest requests first, each with its status, method, path, time and size, and a bar that makes slow calls stand out. Tapping a request opens Headers, Request and Response tabs. JSON responses appear as a tree you can expand and collapse, and any request can be copied as a cURL command.
Logs
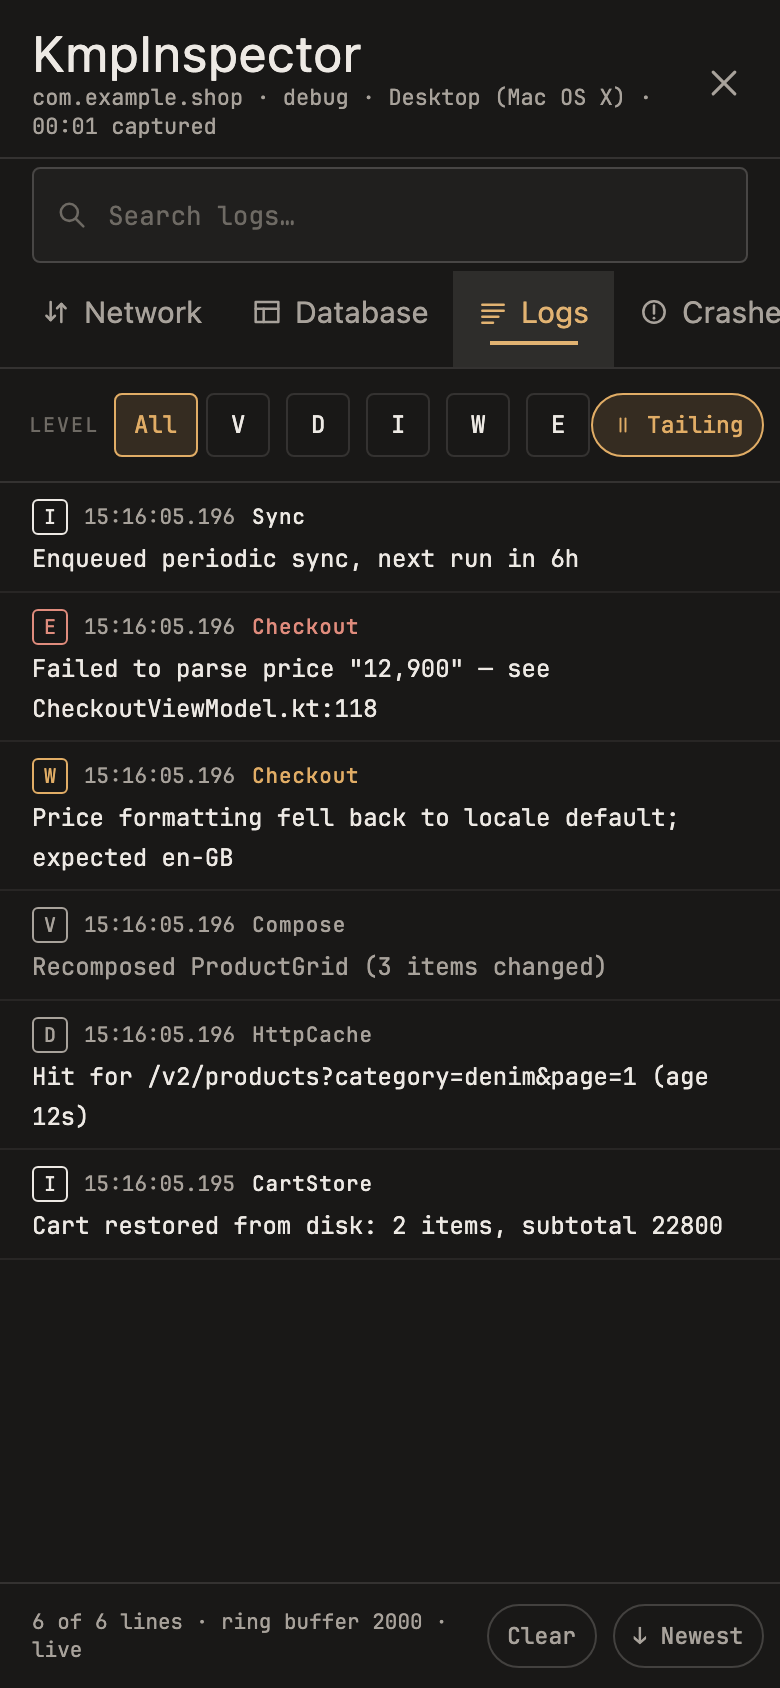
Each log line shows its level (verbose, debug, info, warning or error) and its tag, and you can filter by either. The list follows new lines as they arrive, and you can pause it while you read. On Android the app's logcat flows in automatically; elsewhere you log through InspectorLog, for example InspectorLog.e("Checkout", "Failed to parse price"). The filtered lines can be shared as text.
Crashes
Fatal crashes are saved and still there after the app restarts. Handled exceptions can be recorded with Inspector.recordNonFatal(...), and repeated crashes are grouped with a count. In a stack trace, frames from your own package are highlighted, framework frames can be hidden, and the whole trace can be copied or shared.
The Database panel gets its own article: how to inspect a Room database in Kotlin Multiplatform.
Keeping it out of release builds
The inspector can read your database and run queries against it, so it must not ship switched on. There are two separate questions: whether the inspector runs, and whether its code is in the binary at all.
Stopping it from running
One switch covers every platform. With it off, nothing is captured, no crash handler is installed, no tables are read, and the wrapper renders your content directly:
Inspector.enabled = isDebugBuild // once, at startupRemoving the code: debugImplementation in Kotlin Multiplatform
- Android: R8 removes it. Use the
debugImplementationandreleaseImplementationsplit shown above, so release builds only contain the no-op. - iOS: Kotlin/Native removes unused code, unless your framework exports the library. Do not
export(...)it or turn ontransitiveExport. - Desktop: nothing is stripped on the JVM, so ship a distribution that depends on the no-op instead.
A shared Kotlin Multiplatform module has no debugImplementation, but the choice can still be made at build time. Xcode passes its build configuration in the CONFIGURATION environment variable, and a Gradle property covers desktop:
val inspectorEnabled = System.getenv("CONFIGURATION") != "Release" &&
    providers.gradleProperty("inspectorEnabled").getOrElse("true").toBoolean()

sourceSets {
    commonMain.dependencies {
        if (inspectorEnabled) {
            implementation("io.github.waqas028:kmp-inspector:1.0.0")
        } else {
            implementation("io.github.waqas028:kmp-inspector-no-op:1.0.0")
        }
    }
}
The Ktor and Room companions have no no-op version, because they depend on the real library. Put them behind the same flag, and keep their call sites in code that is only compiled when the inspector is on.
How I use it in my own apps
I use KMP Inspector in my own apps. Dukaan POS, a point of sale for Android, iOS, desktop and the web, uses the library with both companions. KMP Inspector does not publish a browser version, so Dukaan keeps it in a source set shared only by Android, iOS and desktop. On Android it relies on install, and it wraps the UI only on the other platforms.
Shared Khata, my expense-splitting app, uses the debug and no-op split on Android, calls install and attaches its Room database, and records network calls through the OkHttp interceptor inside Ktor's OkHttp engine. On iOS it wraps its main view controller in KmpInspector { }.
Limitations
- There is no web (JavaScript or Wasm) version yet.
- On iOS, crash capture covers uncaught Kotlin exceptions only; Objective-C and Swift exceptions and hard signals do not reach it.
- The Background Work panel is Android only.
- Off Android, network and database data come from the Ktor and Room companions or from your own calls to the API.
- The Network panel keeps the most recent 200 requests, and the Logs panel the most recent 2,000 lines.
Frequently asked questions
Is KMP Inspector free and open source?
Yes. It is open source under the Apache 2.0 license, and the code is on GitHub.
Does it work in an Android app that is not Kotlin Multiplatform?
Yes. KmpInspector.install(this) works in any Android app, including apps built with XML layouts and Fragments.
Can I use it with SQLDelight or another HTTP client?
Yes. Report requests with Inspector.recordRequest(...) and database tables with Inspector.setDatabase(...). The Ktor and Room companions just do this for you.
Will it end up in my release build?
Not if you follow the release section above: depend on the no-op artifact for release builds, and set Inspector.enabled from your debug flag.
Summary
Kotlin Multiplatform lets you share your code across platforms. KMP Inspector lets you share your debugging tools too: one bubble, five panels, on Android, iOS and desktop, with the release build left clean.
Try it from GitHub, and if something does not work as described, please open an issue there. If you need help building a cross-platform app, I work as a Kotlin Multiplatform developer.
Keep reading
All posts →- How to Inspect Ktor Network Requests in Kotlin Multiplatform on Android, iOS and Desktop5 min read
- Room Database Inspector for Kotlin Multiplatform: View, Query and Edit Room on iOS, Android and Desktop5 min read
- POS Software in Pakistan: How to Choose One for Your Shop, and Why I Built Dukaan POS9 min read