How to Inspect Ktor Network Requests in Kotlin Multiplatform on Android, iOS and Desktop
By Muhammad Waqas · · 5 min read
When an API call fails in a Kotlin Multiplatform app, the first step is usually Ktor's Logging plugin. That works well on an Android emulator next to your IDE. On an iPhone you are scrolling through the Xcode console, and on a tester's phone there is nothing to scroll through at all.
This guide shows how to record every Ktor request into KMP Inspector, the open-source in-app debugger I built for Compose Multiplatform, and how to read and share those requests safely on Android, iOS and desktop.
Ktor logging vs an in-app network inspector
Ktor's Logging plugin is great for a quick check: it prints each request and response to a logger. It gets harder when you need more than that:
- It only shows up where you can see the logs. That usually means a device connected to your IDE, or Xcode for iOS.
- Long JSON is hard to read as lines of text mixed in with every other log.
- A single request is hard to share with a teammate or attach to a bug report.
On Android there are other options, such as Android Studio's Network Inspector, which needs the device connected to your computer, and in-app libraries such as Chucker, which work with OkHttp on Android. Neither helps with the iOS or desktop versions of a Kotlin Multiplatform app. An in-app inspector that is fed from shared code covers all three.
Set up the Ktor plugin
Setup takes three steps. First, add the library and its Ktor companion:
implementation("io.github.waqas028:kmp-inspector:1.0.0")
implementation("io.github.waqas028:kmp-inspector-ktor:1.0.0")
Second, wrap your root composable so the bubble and the inspector appear:
@Composable
fun App() {
    KmpInspector {
        MyAppContent()
    }
}
Third, install the plugin where you create your HttpClient. Because the plugin lives in common code, one line covers every platform and every engine:
val client = HttpClient {
    install(KmpInspectorPlugin)
    install(ContentNegotiation) { json() }
}
Changing the body size limit
Text bodies are captured up to a size limit, 256 KB by default. You can change it when installing the plugin:
install(KmpInspectorPlugin) {
    maxBodyBytes = 512 * 1024
}
What gets recorded
- The method and the full URL.
- The status code, how long the call took, and the size of the request and response.
- Request and response headers.
- Text bodies, such as JSON, form data and plain text, up to the size limit.
- Binary responses, such as images, are passed through untouched, with only their size recorded.
- Failures before a response arrives, such as timeouts or no connection, are recorded as ERR with the exception's message, then rethrown, so your own error handling still runs.
Nothing is buffered when the inspector is off. If Inspector.enabled is false, the plugin passes each call straight through without timing it or reading its body.
Reading requests in the Network panel
The Network panel lists the newest requests first. Each row shows a status icon, the method, the path, the time, the response size and a bar for the duration, so slow calls stand out. You can search, filter to errors, slow calls or writes, and clear the list. The panel keeps the most recent 200 requests.
Headers, Request and Response
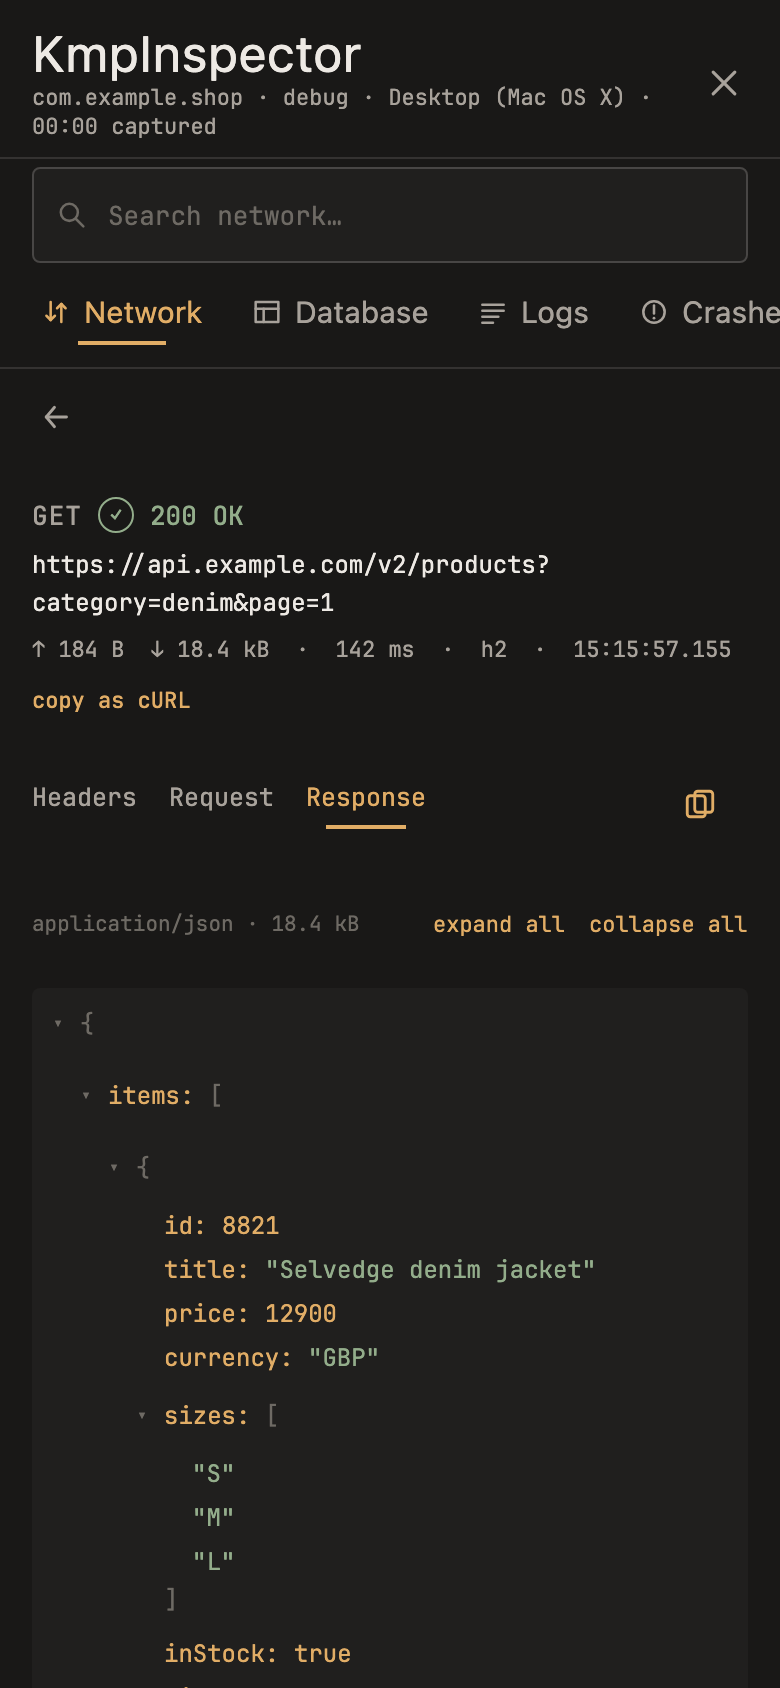
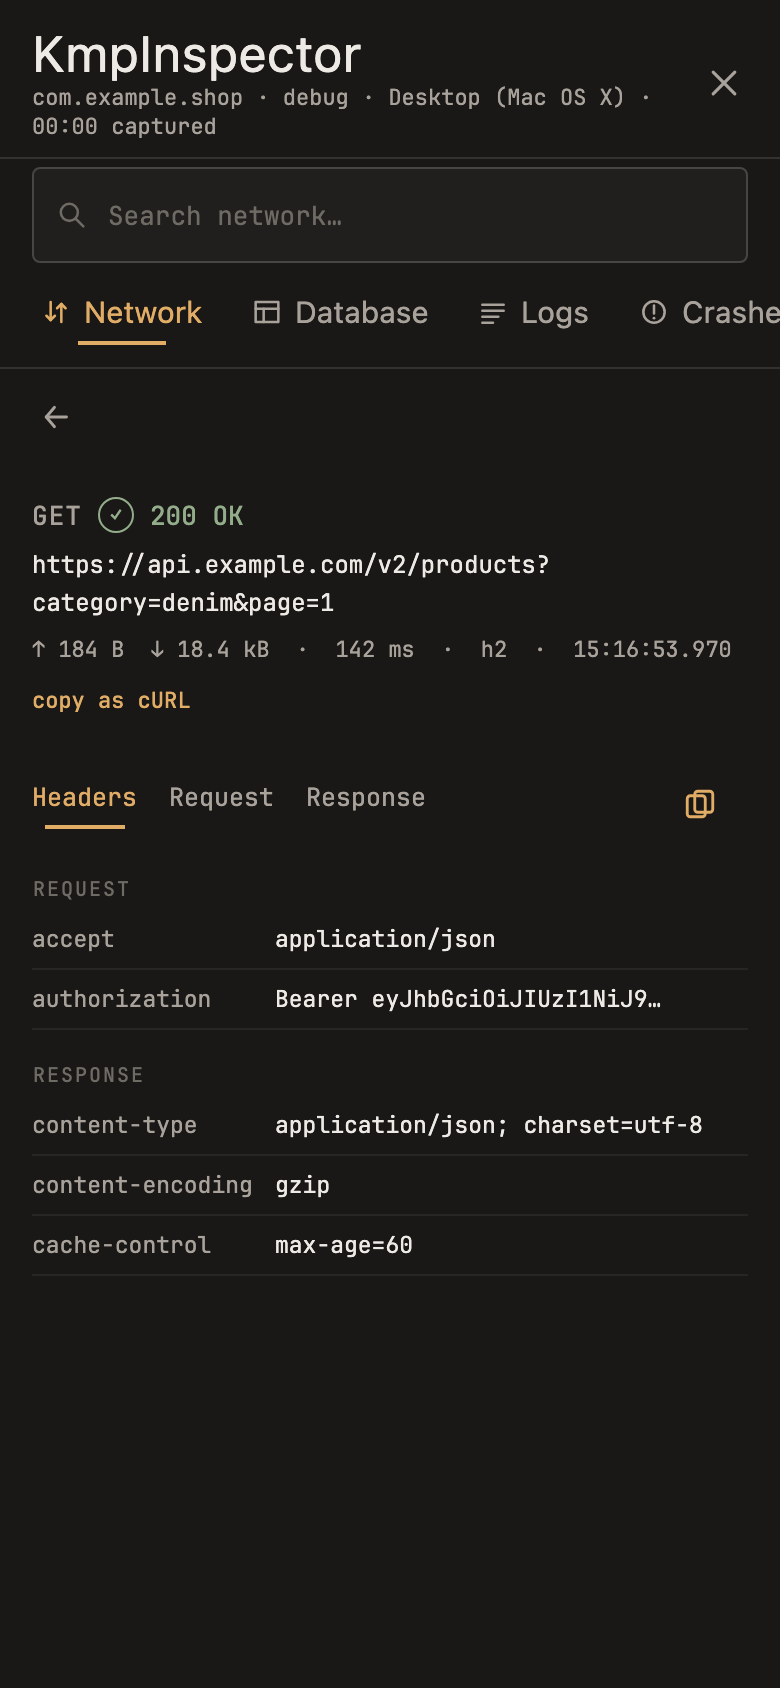
Tapping a request opens three tabs. Headers lists request and response headers. Request and Response show the bodies: JSON as a tree you can expand and collapse, form bodies as a table of fields, and JSON hidden inside a string field expanded as well. The copy button copies whichever tab you are looking at.
Copy as cURL and share
Copy as cURL turns a request into a command you can run in a terminal, which is often the fastest way to show a backend developer exactly what the app sent. The share menu sends a request as cURL, as readable text, or as just the body.
Debugging common API problems
- A 401 Unauthorized: open the Headers tab and check that the
Authorizationheader was actually sent, and with the token you expected. - A 409 or 500: read the Response tab. The server's error body usually says exactly what went wrong, such as a quantity that is no longer available.
- A field that will not parse: compare the JSON tree with your data class. A field that is
null, missing or named differently shows up immediately. - A screen that feels slow: use the Slow filter to find the requests behind it, then check their duration and response size.
- No response at all: requests that never got an answer appear as ERR, with the exception message and how long the app waited.
Sharing safely: header redaction
Shared text tends to end up in chats and tickets, so sharing as cURL or text masks the values of Authorization, Cookie, Set-Cookie, Proxy-Authorization and X-Api-Key. The Headers tab and the copy button stay unmasked, because on your own device you need to see the real values. You can change the list, or pass an empty set to share everything:
Inspector.redactHeaders(setOf("Authorization", "X-Session-Token"))Using OkHttp on Android
If your Android code uses OkHttp directly, or Ktor's OkHttp engine, you can record at the OkHttp level instead. Add the interceptor after any interceptors that add headers, so the recorded request matches what was actually sent:
OkHttpClient.Builder()
    .addInterceptor(KmpInspectorInterceptor())
    .build()
My app Shared Khata does exactly this inside Ktor's OkHttp engine on Android:
HttpClient(OkHttp) {
    engine { addInterceptor(KmpInspectorInterceptor()) }
}
Use one collector per client. If the Ktor plugin and the OkHttp interceptor are both active on the same client, each call is recorded twice.
Any other HTTP client
The inspector is not tied to Ktor or OkHttp. From any client's interceptor or logging hook, report the call yourself:
Inspector.recordRequest(
    method = "GET",
    url = "https://api.example.com/products",
    statusCode = 200,
    durationMillis = 142,
)
Keep it out of release builds
The core library has a no-op version for release builds, but the Ktor companion does not, because it depends on the real library. Put the companion dependency and the install(KmpInspectorPlugin) call behind the same build flag you use for the inspector, and set Inspector.enabled from your debug flag. The full setup for Android, iOS and desktop is in the release builds section of the KMP Inspector guide.
Frequently asked questions
Does it work on iOS?
Yes. The Ktor plugin runs in common code, so requests made through the Darwin engine on iOS are recorded the same way as on Android and desktop.
Should I remove Ktor's Logging plugin?
No, you can keep both. Logging is still useful in the console; the inspector adds a searchable, shareable view on the device.
Can I see requests from a tester's phone?
Yes, on a debug build. The tester opens the bubble, finds the request, and shares it as cURL or text, with sensitive headers masked.
Summary
Ktor logging tells you something happened. An in-app network inspector shows you exactly what happened, on the device where it happened, on Android, iOS and desktop alike. Install the plugin once in shared code, keep it out of release builds, and share requests without leaking tokens.
The library is open source on GitHub. Next, see how the same inspector handles your data in Room database inspection for Kotlin Multiplatform.
If your team needs help building or debugging a Kotlin Multiplatform app, I work as a Kotlin Multiplatform developer.
Keep reading
All posts →- KMP Inspector: An In-App Debugger for Compose Multiplatform on Android, iOS and Desktop7 min read
- Room Database Inspector for Kotlin Multiplatform: View, Query and Edit Room on iOS, Android and Desktop5 min read
- POS Software in Pakistan: How to Choose One for Your Shop, and Why I Built Dukaan POS9 min read